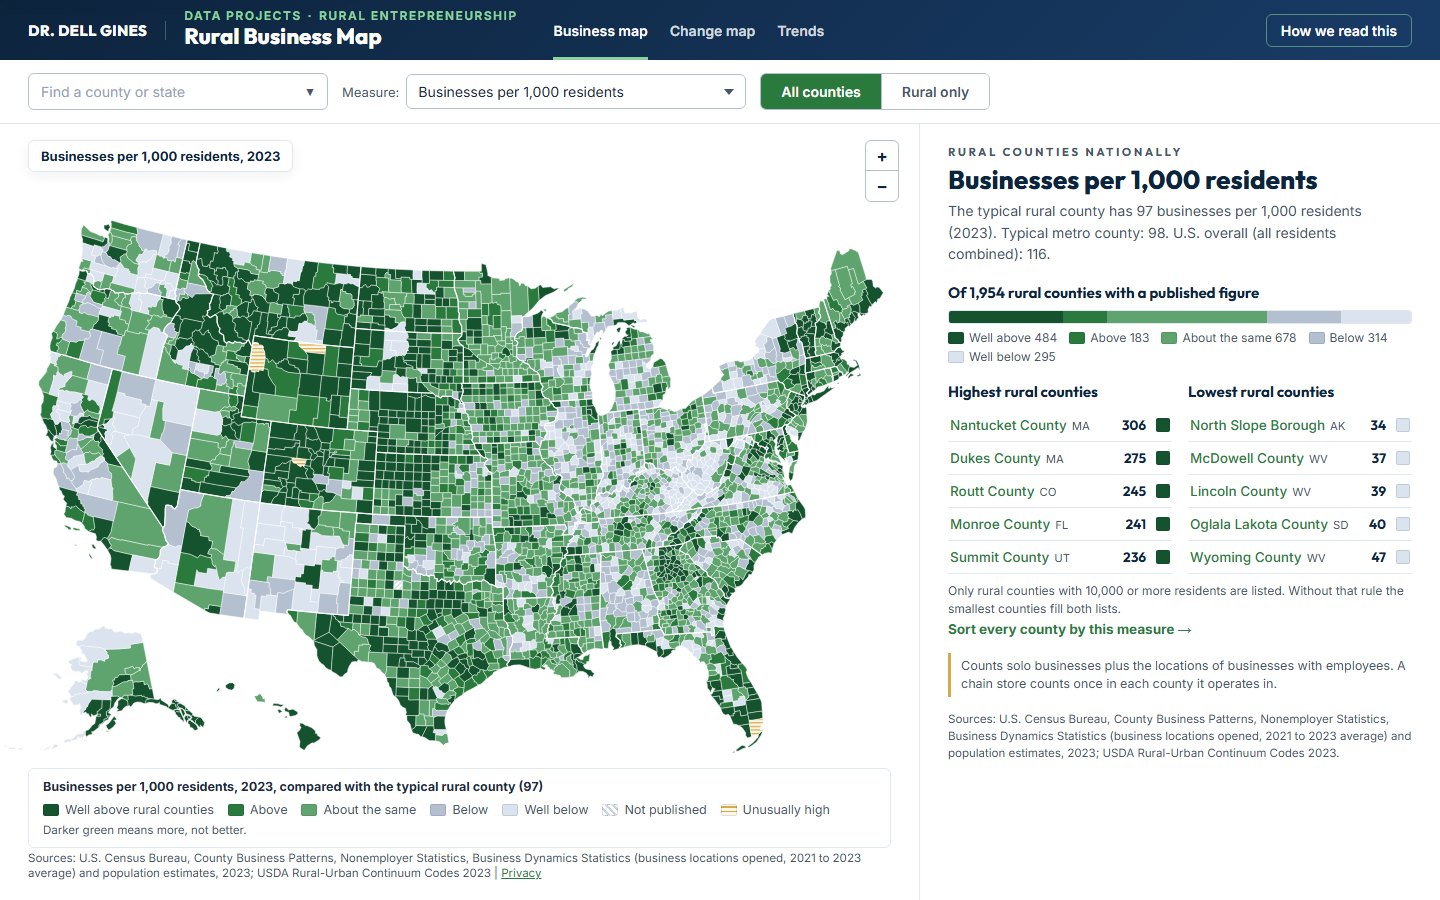
Interactive Map | Census data, 2023
Rural Business Map
Every U.S. county on three measures: businesses per resident, jobs by business size, and business locations opened, each compared with rural counties nationally.
Open the map →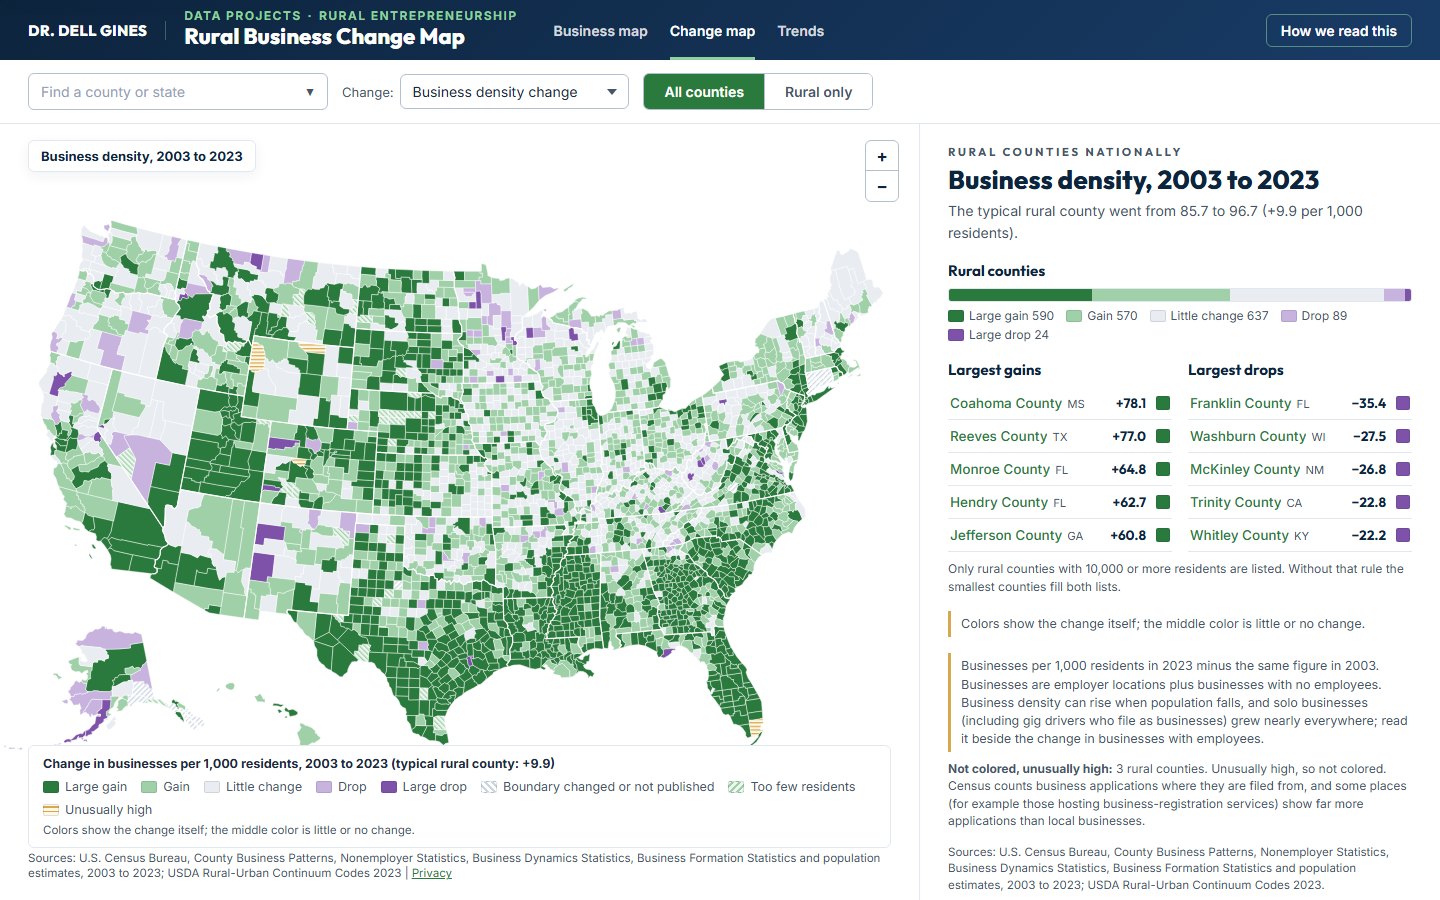
Interactive Map | Census data, 2003 to 2023
Rural Business Change Map
How each county moved over 20 years: business density, openings minus closures, businesses with employees, and recent startup activity.
Open the map →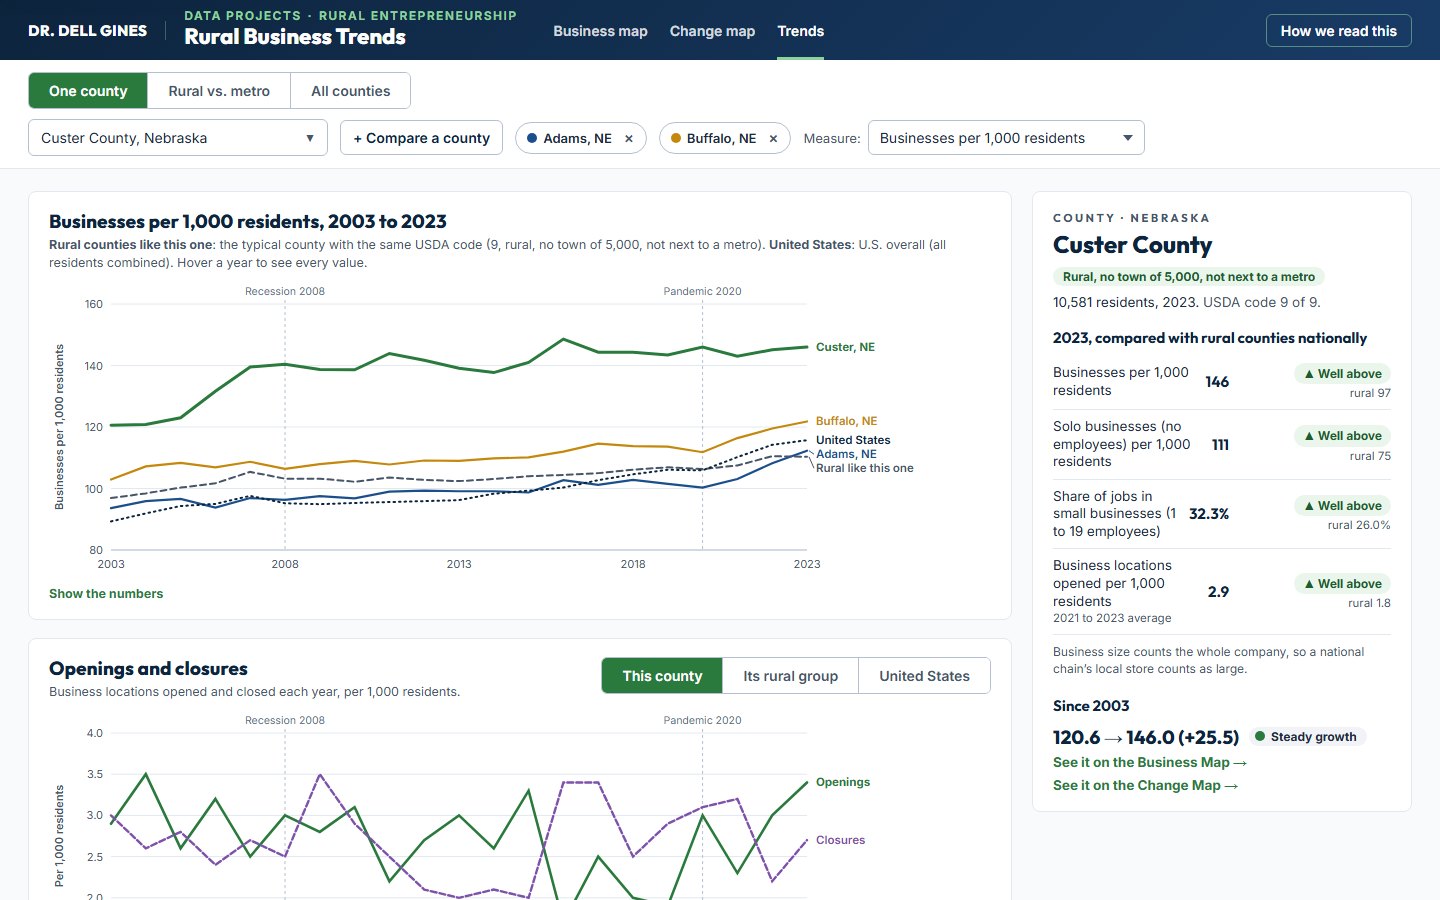
Charts and Tables | Census and USDA, 2003 to 2023
Rural Business Trends
Pick a county and see its 20-year story beside its rural peers and the nation, or sort every county by any measure and download the table.
Open the trends →