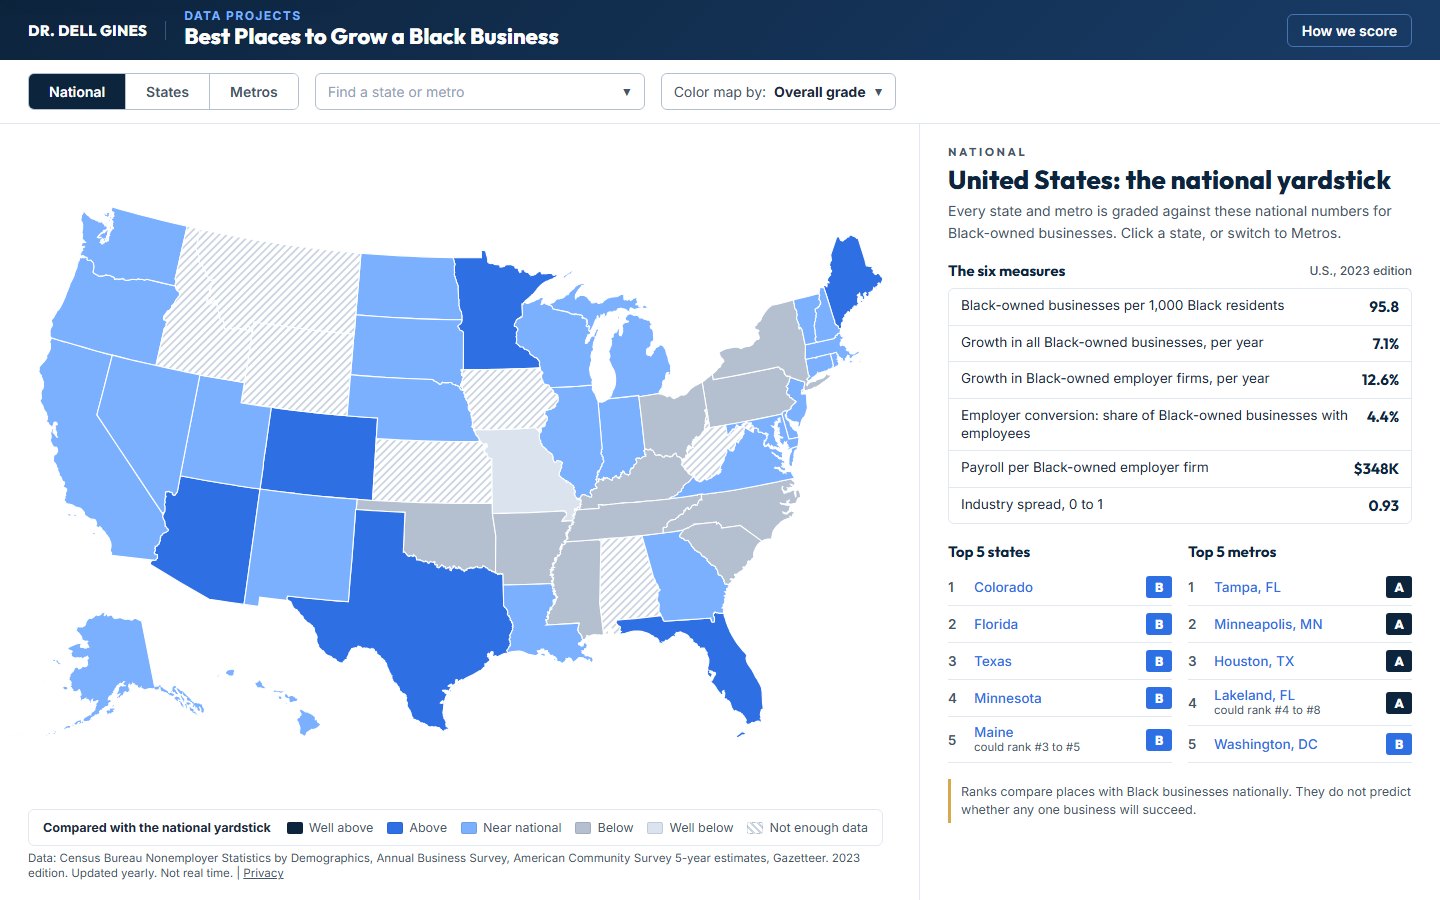
Interactive Map | Census data, updated yearly
State and Metro Rankings
U.S. states and metro areas graded on how Black-owned businesses there compare with Black-owned businesses nationally.
Open the map →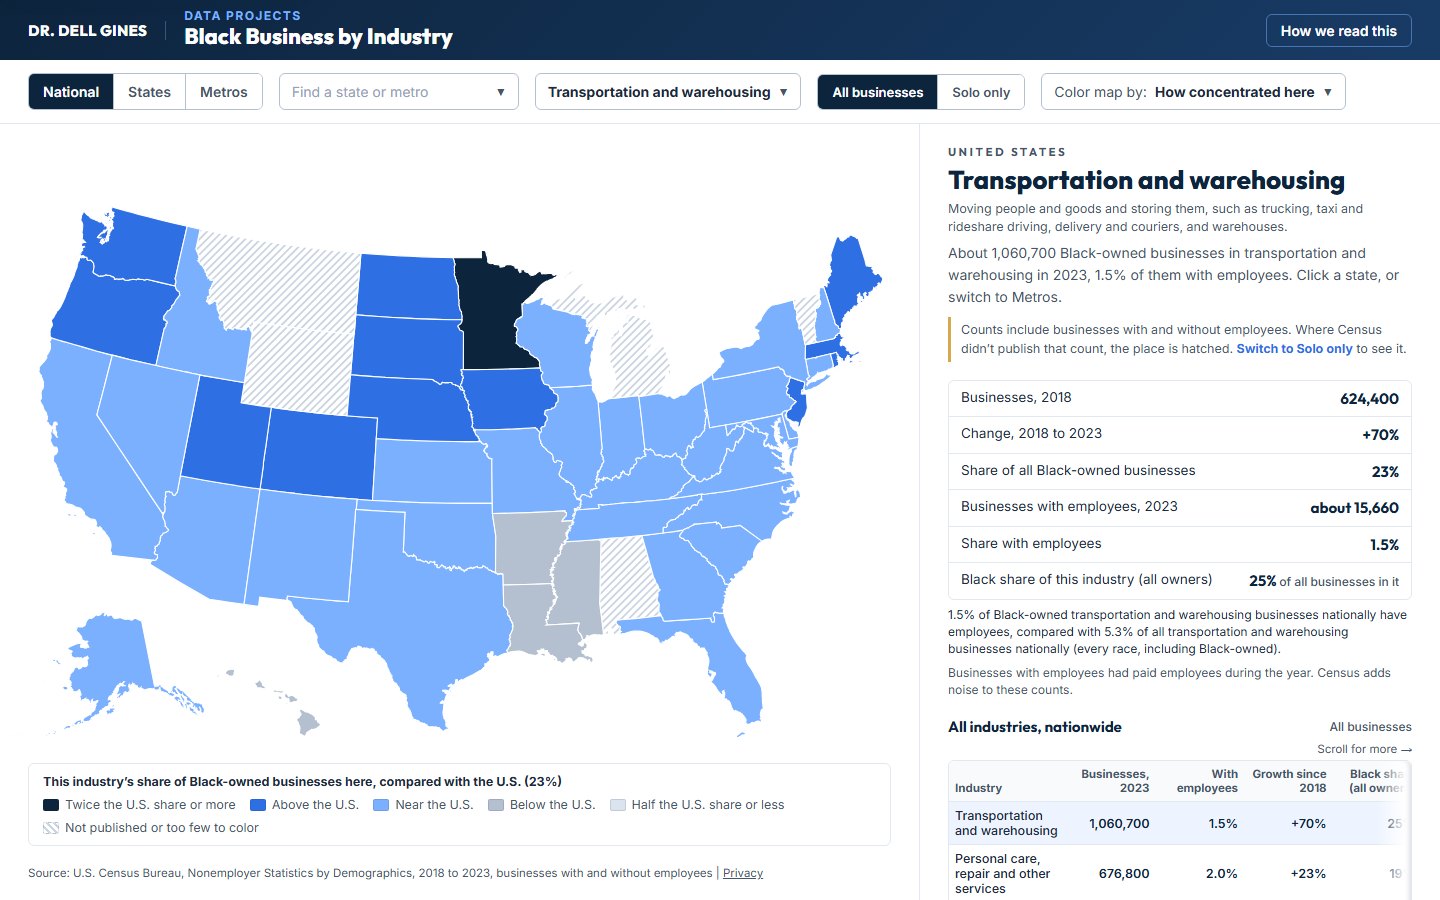
Interactive Map | Census data, 2018 to 2023
Black Business by Industry
Where Black-owned businesses are concentrated across 18 industries, how fast each industry is growing, and the Black share of each, by state and metro.
Open the map →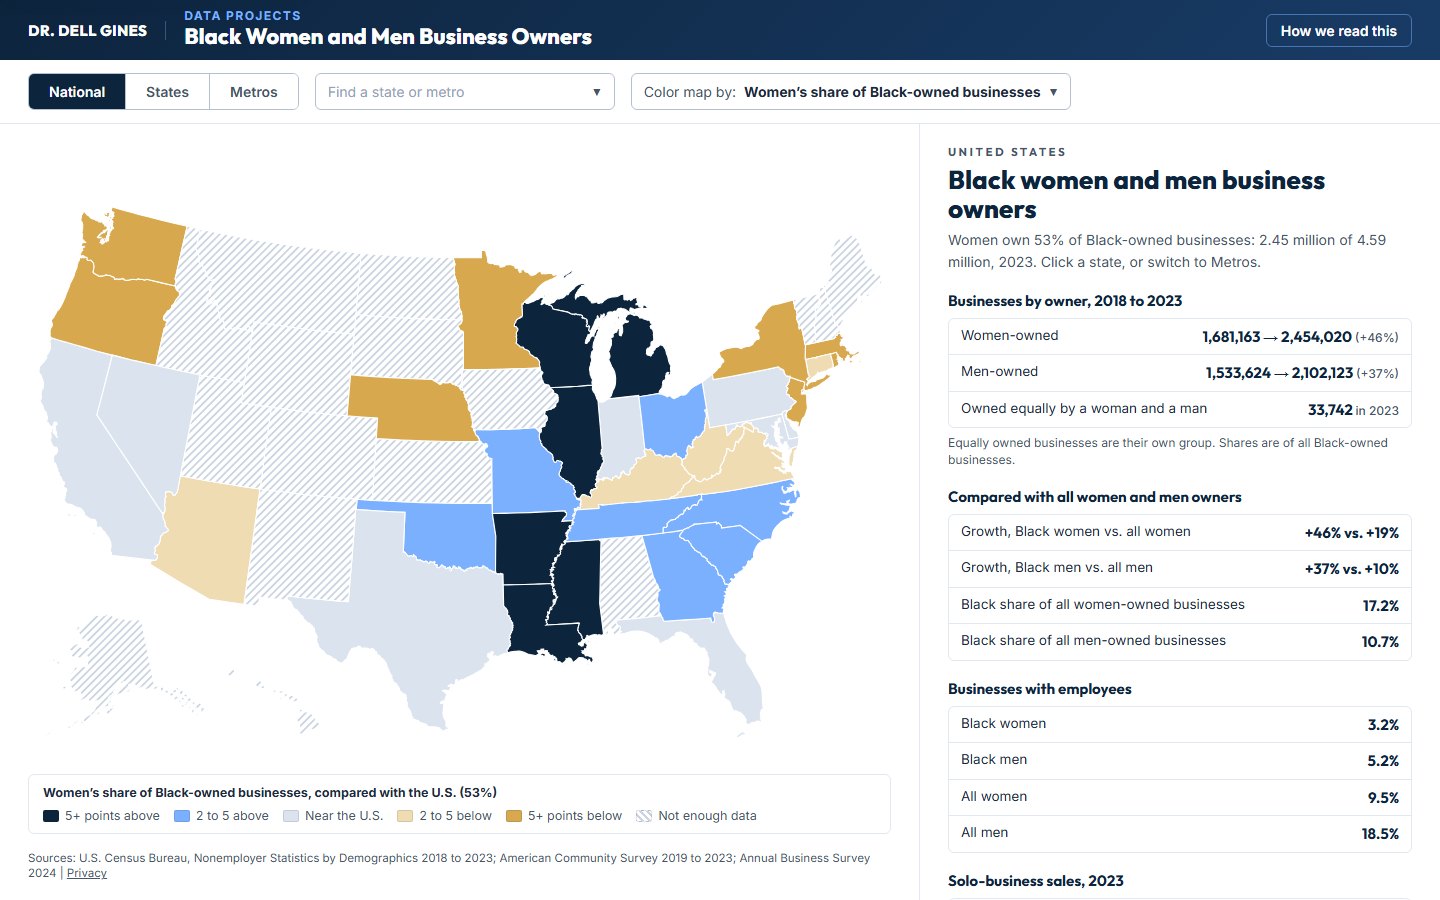
Interactive Map | Census data, 2018 to 2023
Black Women and Men Business Owners
How Black women and men business owners compare on growth, employees and sales, and who the typical owner is, by state and metro.
Open the map →