The investment number is not the public bargain.
Dr. Dell Gines explains why data-center benefits and costs must be mapped across the jurisdictions and systems that actually receive or carry them.
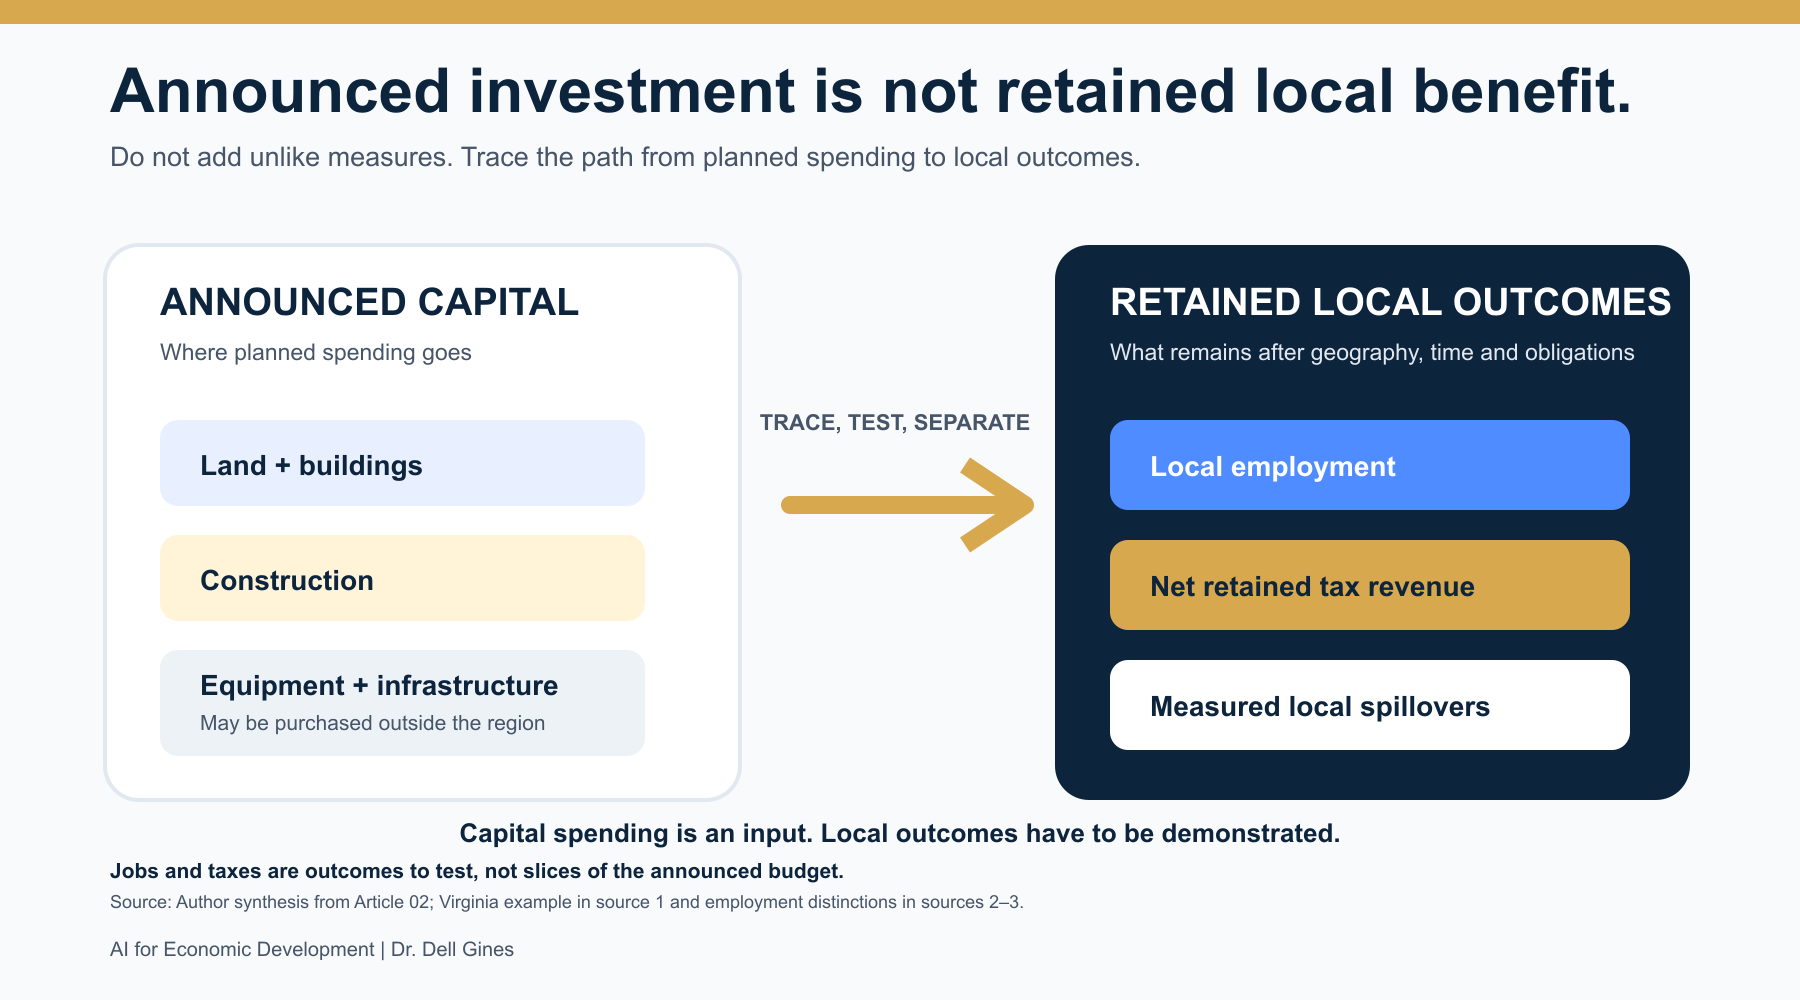
Watch on YouTubeWhen a data center project comes to a community, the first number put in front of the public is usually the investment number, because a multibillion-dollar announcement is easy to understand and it sounds like an economic development win before anyone has examined what it will produce locally. That number tells us what a company plans to spend on land, buildings, equipment and infrastructure. It does not tell us how many permanent jobs residents will hold, how much tax revenue the local government will keep after incentives, what new power infrastructure will cost, who will pay for it or how much water the full system will use.
Those questions are the public bargain. Economic developers have to evaluate that bargain across more than one map, because the place that receives the most visible benefit may not be the place that carries the largest cost.
AI now has a physical address
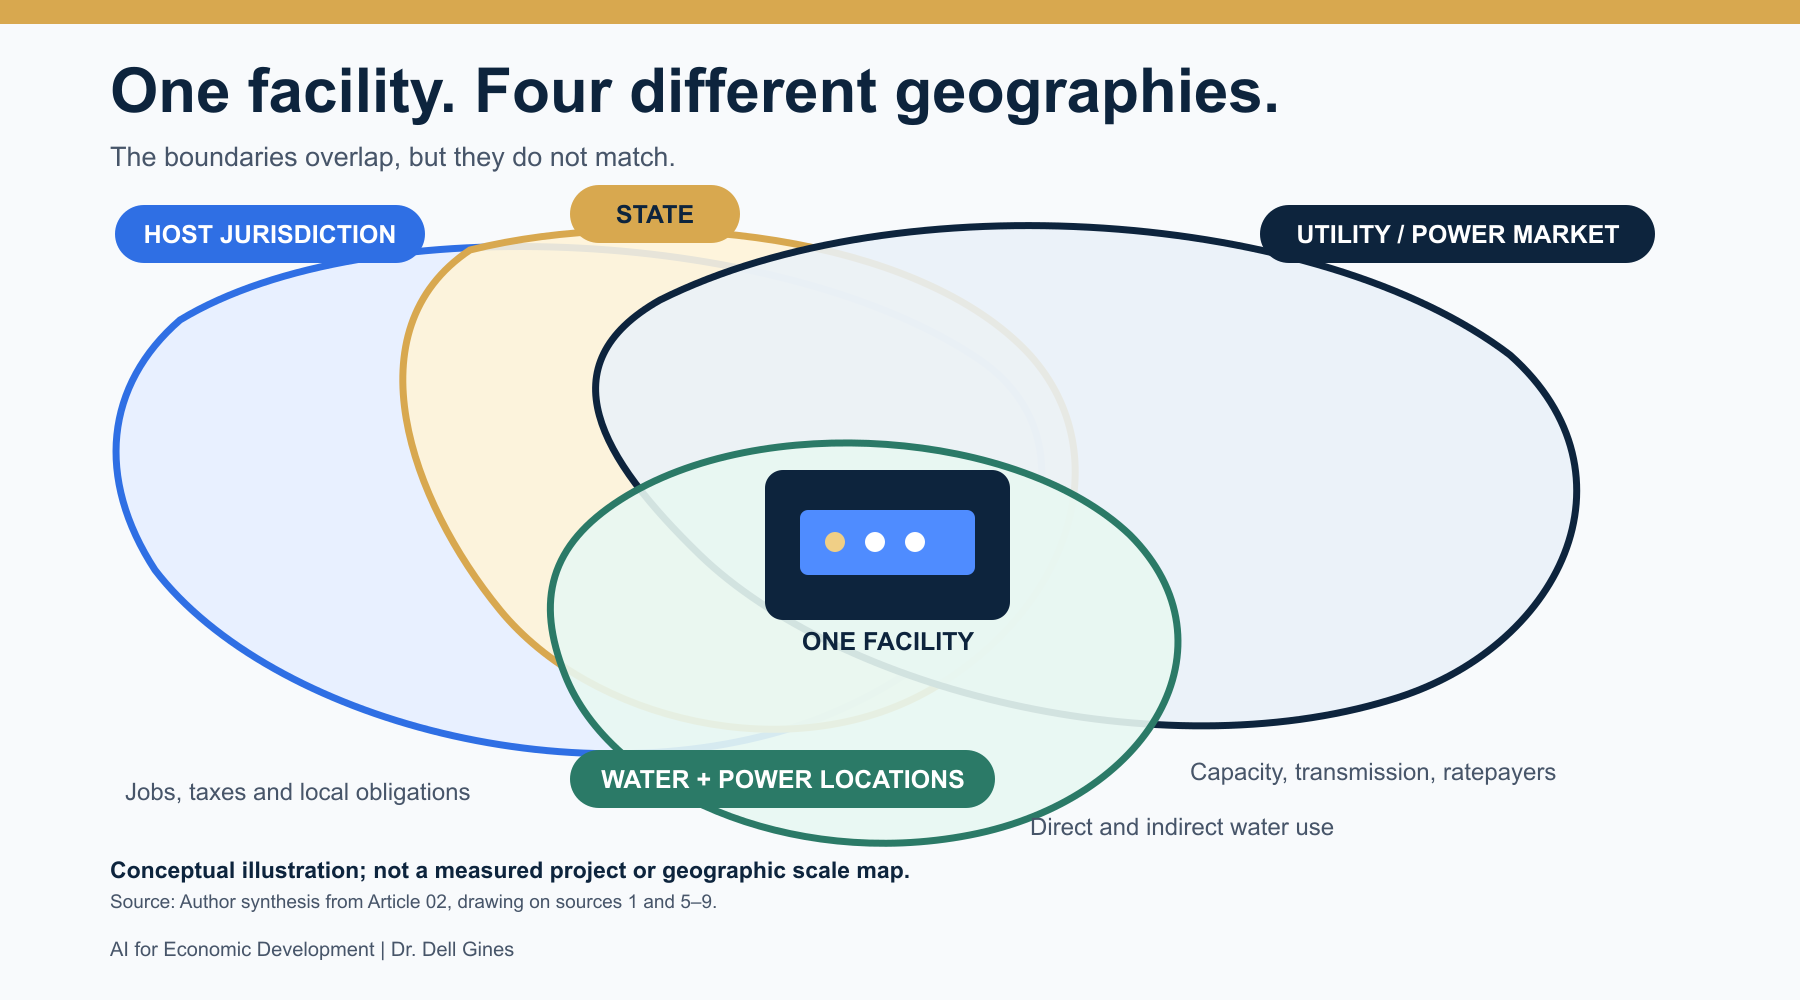
Artificial intelligence gets discussed as if it lives in the cloud, but the cloud is a network of buildings tied to power plants, transmission lines, substations, water systems and local roads. A data center may sit inside one county while the system supporting it stretches across an electric grid, a state tax structure and a regional water supply.
That difference in scale matters because we usually frame local economic development decisions around the host jurisdiction. We ask how many jobs a project will create, how much property tax it will generate and what construction it will bring, while the power, incentive and water questions get decided or absorbed somewhere else. Put those figures into one benefits-and-costs table without showing their geography and you create the appearance of a clean comparison, even though the numbers describe different populations, budgets and time periods.
Announced investment is not a local outcome
Economic developers are trained to separate an announcement from an outcome in almost every other kind of project, and data centers deserve the same discipline. Virginia shows why. Its legislative auditors, the Joint Legislative Audit and Review Commission (JLARC), found that construction makes up about 20 percent of data center capital investment and provides the primary benefit to the state economy, while 68 percent goes to IT and mechanical equipment, most of it bought from out-of-state companies. They attributed 80 percent of the industry's annual jobs to the construction phase.[1]
Permanent jobs need the same scrutiny. Brookings estimates roughly 100 to 200 jobs in data processing and telecommunications in a typical treated county over the first decade, with unchanged wages and home prices up 2 to 5 percent.[2] A separate study of 1,584 data centers estimates 1,000 to 1,300 additional nonconstruction jobs outside the facilities three to five years after opening, and its authors associate a 100-megawatt facility with roughly 275 such jobs.[3] These estimates count different work, periods and comparison groups, so they do not compete, and neither settles the case for a proposed project. Both also rest on data that ends before the current generation of AI-scale campuses. Permanent job gains appear real but limited. Any proposed project needs its own employment assumptions tested against the facility type, the operating model and the local labor market.
Spillover claims deserve the same treatment. That second study found gains in transportation and warehousing, professional and technical services and real estate, with little evidence of growth in restaurants, stores and other local services.[3] If the public case depends on spillover development, name those spillovers and measure them.
The benefits can be local and meaningful
Data centers can still deliver a real economic development benefit, and in some communities the strongest case is the tax base, because a capital-intensive facility can generate substantial property and equipment tax revenue. Loudoun County, Virginia, is the most visible example.[4]
One county cannot serve as a national answer. Among Virginia's five most mature markets alone, data center revenue ranged from less than 1 percent to 31 percent of total local revenue, and JLARC estimated that a county could collect anywhere from $0.4 million to $10.8 million over five years on the same $150 million in computer equipment, depending on its tax rate and depreciation schedule.[1] A director has to move past the gross estimate and identify the revenue the jurisdiction will actually keep, the year it begins, how it changes as equipment depreciates, what obligations sit against it and what happens if the project is delayed, reduced or sold.
Each benefit should also be shown at the scale where it is received. County revenue is county revenue, and a separate school district benefit is a separate line. Folding them into one large public-benefit number hides which institution gains, which one takes on an obligation and whether the money can pay for what residents assume it will.
The costs do not stop at the county line
Power is where the mismatch is easiest to see. A data center may be approved locally while the generation, transmission and capacity needed to serve it are planned and paid for across a much larger utility territory or regional power market. Federal and state officials, PJM, utilities and regulators are now working out rules meant to make large new loads pay for what they require instead of shifting those costs to other customers.[7]
The evidence does not support one national claim about household electricity prices. Rutgers found weak, mixed effects, small in magnitude, through 2024, and warned that limited effects so far do not settle what happens as demand accelerates.[5] In the capacity-constrained PJM market, the independent market monitor attributed $6.3 billion, or 38.2 percent of the charges in the 2028/2029 base residual auction, to data center demand.[6] In Virginia, JLARC found in 2024 that data centers were paying their full cost of service, yet estimated that a typical Dominion residential customer's generation and transmission costs could rise $14 to $37 a month by 2040 in constant dollars.[1] In the other direction, a Charles River Associates review commissioned by Edison Electric Institute, an electric-industry association, found that regulators accepted projections that data centers would lower rates for other customers when protections were in place. Most reported savings were projected rather than observed, and the report treated PJM separately.[7] These findings measure different places and conditions, so ratepayer exposure depends on the market, the contract structure, the timing and the rules governing who funds new capacity.
Tax incentives create a similar split. Most states exempt data centers from sales tax or have no sales tax at all,[1] so a host community may collect property tax while the state, and sometimes other local governments, give up sales tax, and the two figures may never appear in the same public presentation. Washington's preliminary legislative review found that beneficiaries saved an estimated $42.4 million from fiscal years 2023 through 2026, while no new urban data centers were built using the preference.[8] JLARC found that Virginia's exemption added about $6 million in income for every $1 million spent, yet returned 48 cents in state revenue for every dollar, compared with 41 cents for the average Virginia incentive.[1] Those are different kinds of numbers. Washington's is a tax saving, and Virginia's two figures show that one incentive can look strong on income and weak on state revenue.
Water adds another layer, because a facility's direct use may not capture the water consumed in producing its electricity. In Arizona, where regulators do not require utilities to report water use at generating plants, a researcher at a utility watchdog group told KJZZ "we don't even have a very good inventory" of water used for electricity generation, and the report explained that power plants can account for a larger share of the footprint than the site itself.[9] The relevant geography can be a municipal system, a river basin, an aquifer or the power plants serving the grid, so a project described as low-water on site may still carry a larger footprint off site. Not every project creates a water problem. The boundary of the analysis still has to match the system being affected.
The map is part of the analysis
A project can produce a legitimate benefit for one institution while creating a legitimate cost or risk for another. A county may strengthen its tax base, a state may absorb an incentive cost, a regional grid may need new capacity and ratepayers outside the host community may carry part of the exposure.
I draw that distribution from evidence measured at different scales. It is an inference, and the sources reviewed here do not show that every host community wins while everyone else pays. The point is not to replace boosterism with opposition. The point is to stop placing unlike figures on a balance scale and netting them into one answer.
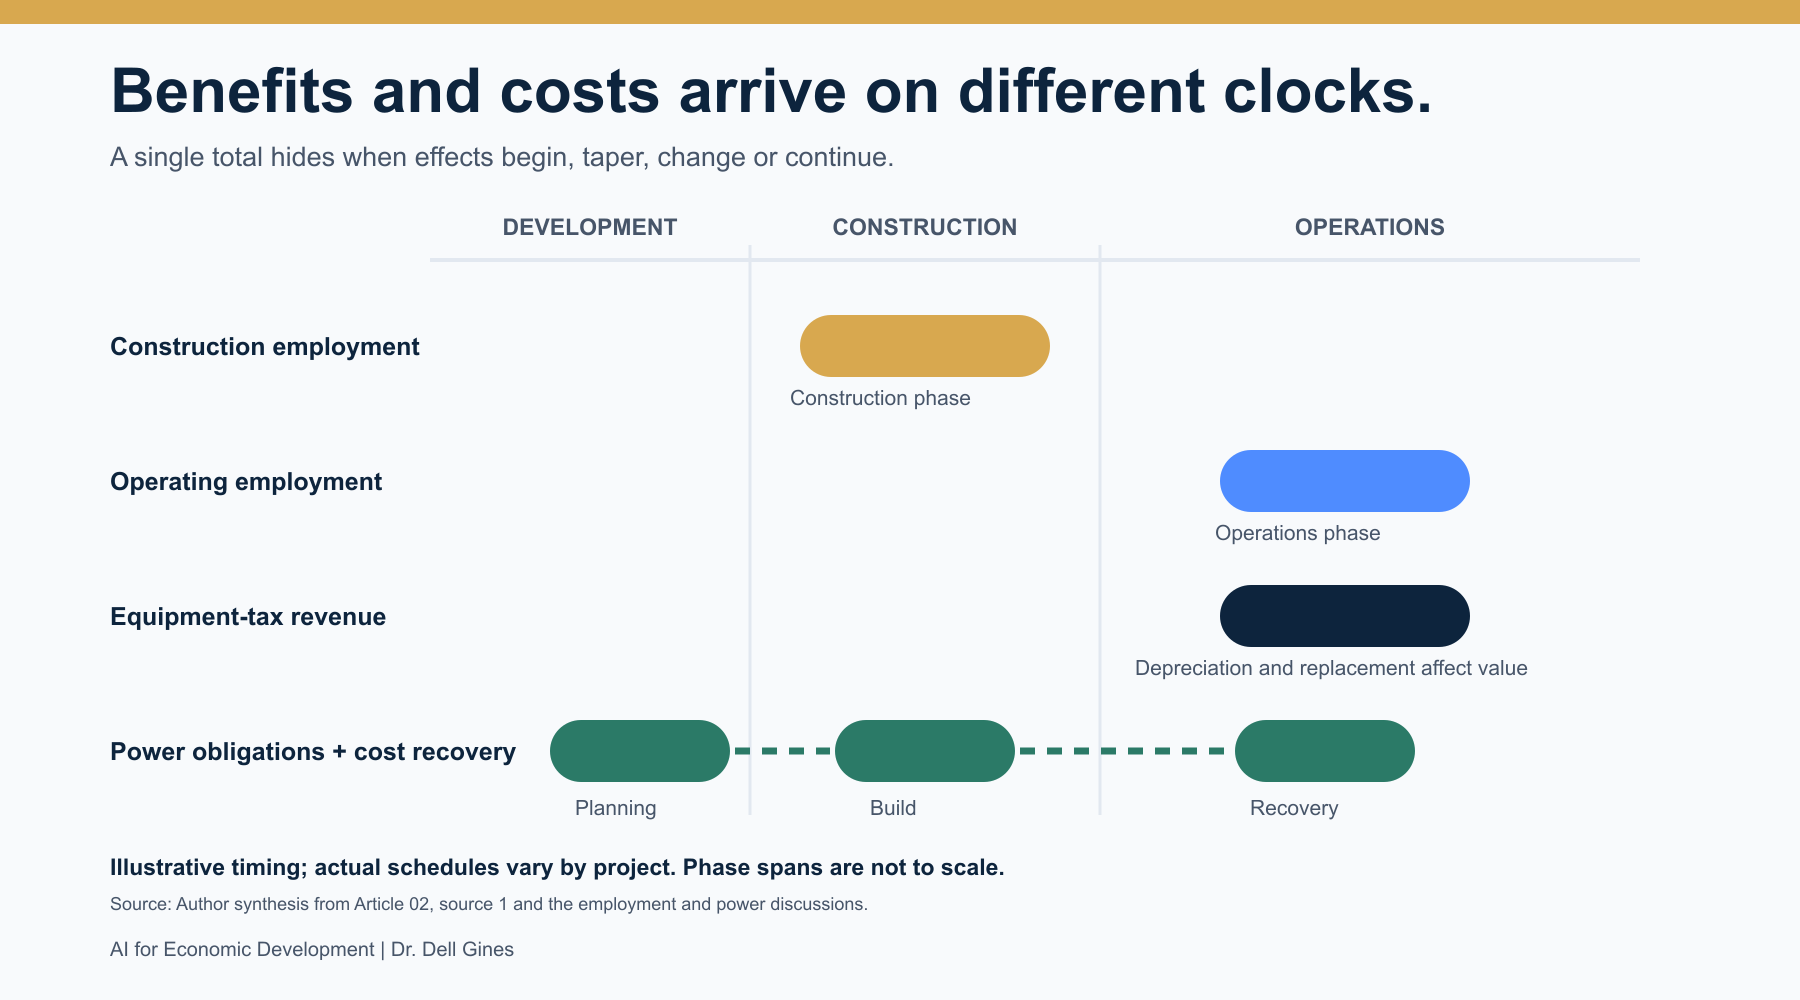
A credible project analysis should show at least four geographies. They are the host jurisdiction receiving jobs and local taxes, the state financing incentives, the utility territory or power market funding infrastructure and capacity, and the water systems and power-plant locations behind direct and indirect water use. It should also show time, because construction employment arrives first, permanent employment may take several years, tax revenue changes with depreciation and power costs may appear only after new infrastructure is built.
No national average can answer the local question
National research shows the range of possible outcomes and exposes claims that should not be accepted on faith, but an average across facilities cannot substitute for analysis of a particular proposal. Data centers differ by size, computing purpose, cooling system, power arrangement, ownership and tax treatment. Communities differ in grid capacity, water availability, labor markets, land-use priorities and fiscal structure.
If a community asks only whether data centers create jobs, generate taxes or raise electric bills, it will get three national arguments and still have no answer about the project in front of it. The useful questions are which jobs this facility creates and when, which revenues this jurisdiction keeps and for how long, which infrastructure this load requires, who is contractually responsible for paying for it and what water system it depends on.
The most defensible position for an economic development organization is to refuse both automatic recruitment and automatic rejection, and to require the developer, the utility and the relevant public bodies to put the same project-specific assumptions on the table before the community is asked to decide.
What this means for economic development
Economic developers do not control every part of a data center deal. Utilities control interconnection and rate structures, states control many incentives, and elected bodies control zoning, taxation and public agreements. But the EDO often helps define the opportunity before those decisions are made, and that position carries a responsibility to frame the project honestly, separating announced capital from realized local outcomes and making uncertainty visible instead of letting one large investment number stand in for the entire public bargain.
If you are evaluating a proposal, I recommend making your organization's support conditional on an independent analysis commissioned by a public body or another party not paid by the developer or utility. That analysis should answer seven questions:
- Who receives each claimed benefit?
- Who pays each identified cost?
- What geographic boundary does each estimate cover?
- What period does it cover?
- What assumptions drive the result?
- Which public body can enforce each commitment?
- What changes if employment is lower, construction is delayed, power infrastructure costs more, tax values depreciate faster or the requested load grows?
If the project has already been announced, the same questions still apply, and the EDO can ask that further public support stay conditional until the answers are documented. Article 3 will take the next step, examining how communities can set disclosure, participation and agreement rules before a named prospect creates pressure for an immediate decision.
The communities that ask who benefits and who pays before they take a position will negotiate from evidence. The ones that compare a county tax estimate with a regional power cost and call the difference an answer will still be arguing about the wrong map.
Sources
Sources and claims were reviewed as of October 30, 2026. The two employment studies are cited from their authors' public summaries, not the full papers. Differences between estimates are stated, not resolved by selecting one.
- Joint Legislative Audit and Review Commission, Data Centers in Virginia, Report 598, December 9, 2024.
- Bahar, D., and Wright, G., New evidence on data center employment effects, Brookings Institution, May 4, 2026, updated August 10, 2026.
- Buechler, S., and Rolheiser, L., We studied 1,584 data centers – and found the buildings full of machines are tied to modest local job growth, The Conversation, October 2026.
- Ban, C., National Association of Counties, The "Backslash Backlash:" Counties pivot in the data center buildout, October 20, 2026.
- Garimella, K., Are Data Centers Raising Your Electric Bill? Mostly Not. Yet., New Jersey State Policy Lab, Rutgers, June 22, 2026.
- Monitoring Analytics, Market Monitor Report, PJM Members Committee webinar, July 27, 2026.
- DeCourcey, M., and Saraswat, M., Retail rate trends in the US: Fall 2026 Update, Charles River Associates, prepared for Edison Electric Institute, October 19, 2026.
- Washington Joint Legislative Audit and Review Committee, 2026 tax preference review: Data Centers in Urban Counties, preliminary report, July 2026.
- Hager, A., Arizona data centers drive up water demand, but not the way you might think, KJZZ, October 28, 2026.